|
| Übungsaufgaben zu Statistik - Grafische Darstellung |
|
|
|  | |
|
|  | | Übungsaufgabe Nr.: 0088-1a | | Statistik, Theoretische Verteilungen
Grafische Darstellung, Stetige Gleichverteilung |
| |
| | |
|
|
|  | |
|
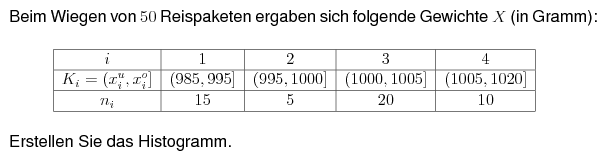
| | | Übungsaufgabe Nr.: 0091-1a | | Statistik, Empirische Verteilungen
Grafische Darstellung, Histogramm |
| |
| | |
|
 |
|
|
|  | |
|
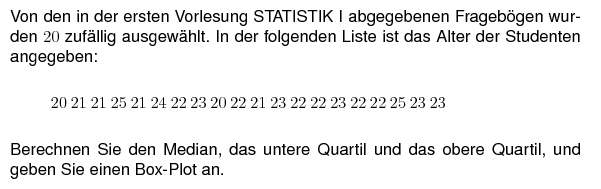
| | | Übungsaufgabe Nr.: 0092-1c | | Statistik, MaÃzahlen
Box-Plot, Grafische Darstellung, Median, Quantil, Quartil |
| |
| | |
|
|
|  | |
|
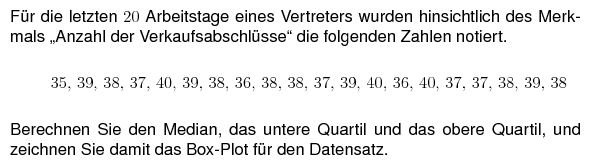
| | | Übungsaufgabe Nr.: 0093-1bc | | Statistik, MaÃzahlen
Box-Plot, Grafische Darstellung, Median, Quantil, Quartil |
| |
| | |
|
|
|  | |
|
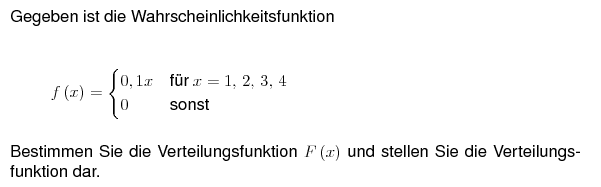
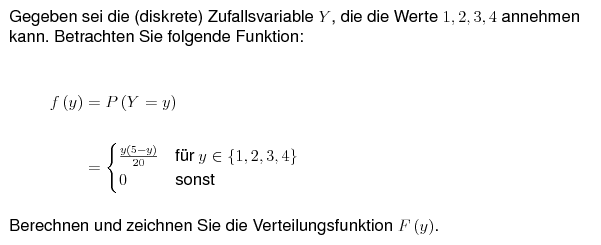
| | | Übungsaufgabe Nr.: 0093-3b | | Statistik, Zufallsvariable
Diskrete Zufallsvariable, Grafische Darstellung, Verteilungsfunktion |
| |
| | |
|
|
|  | |
|
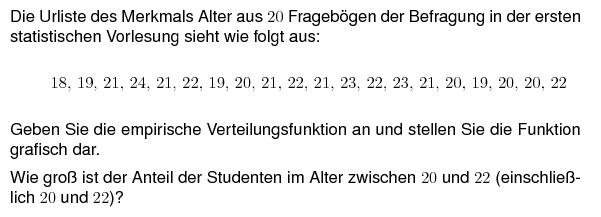
| | | Übungsaufgabe Nr.: 0094-1b | | Statistik, Empirische Verteilungen
Empirische Verteilungsfunktion, Grafische Darstellung |
| |
| | |
|
|
|  | |
|
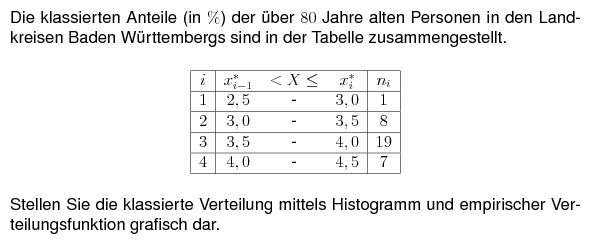
| | | Übungsaufgabe Nr.: 0086-1a | | Statistik, Empirische Verteilungen
Empirische Verteilungsfunktion, Grafische Darstellung, Histogramm |
| |
| | |
|
|
|  | |
|
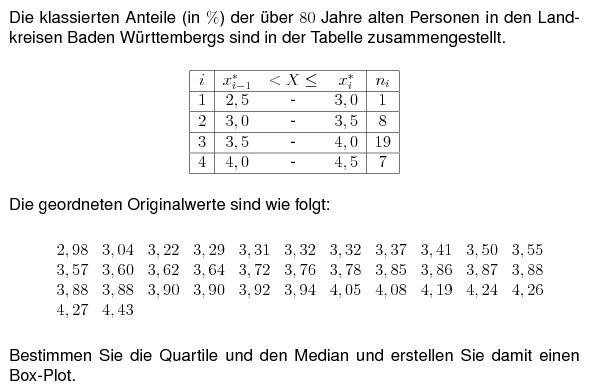
| | | Übungsaufgabe Nr.: 0086-1c | | Statistik, MaÃzahlen
Box-Plot, Grafische Darstellung, Median, Quantil, Quartil |
| |
| | |
|
|
|  | |
|
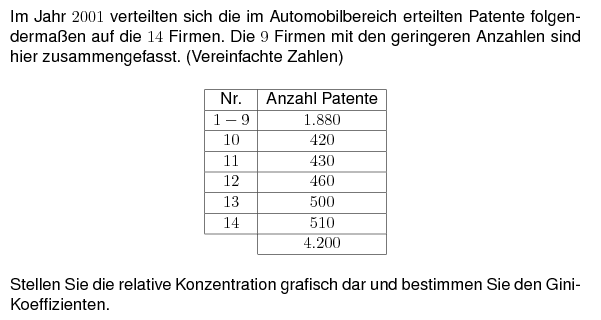
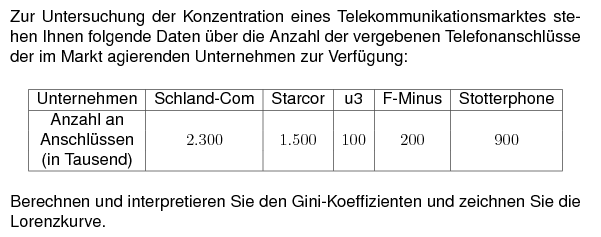
| | | Übungsaufgabe Nr.: 0086-3 | | Statistik, Konzentrationsmessung
Gini-Koeffizient, Grafische Darstellung, Lorenz-Kurve |
| |
| | |
|
|
|  | |
|
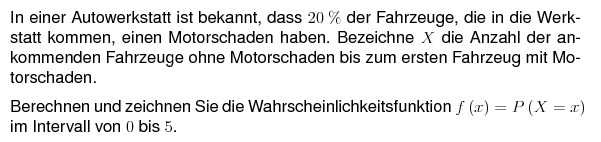
| | | Übungsaufgabe Nr.: 0087-3b | | Statistik, Theoretische Verteilungen
Geometrische Verteilung, Grafische Darstellung |
| |
| | |
|
|
|  | |
|
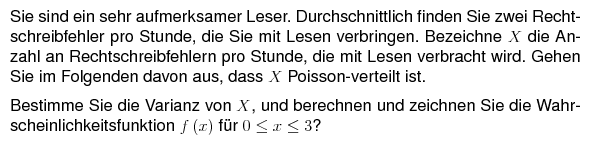
| | | Übungsaufgabe Nr.: 0088-3a | | Statistik, Theoretische Verteilungen
Grafische Darstellung, Poisson-Verteilung, Varianz |
| |
| | |
|
|
|  | |
|
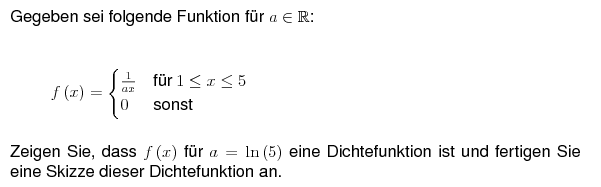
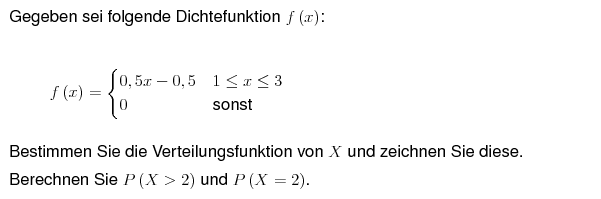
| | | Übungsaufgabe Nr.: 0089-3a | | Statistik, Zufallsvariable
Dichtefunktion, Grafische Darstellung, Stetige Zufallsvariable |
| |
| | |
|
|
|  | |
|
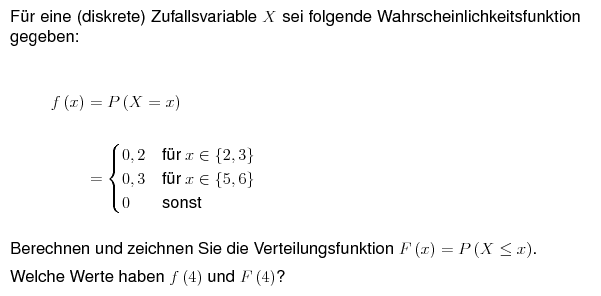
| | | Übungsaufgabe Nr.: 0089-8 | | Statistik, Zufallsvariable
Diskrete Zufallsvariable, Grafische Darstellung, Verteilungsfunktion, Wahrscheinlichkeitsfunktion |
| |
| | |
|
|
|  | |
|
| | | Übungsaufgabe Nr.: 0090-2 | | Statistik, Konzentrationsmessung
Gini-Koeffizient, Grafische Darstellung, Lorenz-Kurve |
| |
| | |
|
|
|  | |
|
| | | Übungsaufgabe Nr.: 0090-4bef | | Statistik, Zufallsvariable
Grafische Darstellung, Stetige Zufallsvariable, Verteilungsfunktion |
| |
| | |
|
|
|  | |
|
| | | Übungsaufgabe Nr.: 0087-2c | | Statistik, Zufallsvariable
Diskrete Zufallsvariable, Grafische Darstellung, Verteilungsfunktion |
| |
| | |